We have all been there as web users. You navigate to a sleek, modern website, and everything looks completely loaded. The images are crisp, the text is sharp, and the layout looks stable. You confidently click a mobile navigation menu button, or tap an accordion to expand a shipping FAQ, and... absolutely nothing happens.
For a split second, you wonder if your phone screen missed your touch. You tap it again, a little harder this time. Suddenly, the interface jerks open all at once, registering both of your frantic taps. That frustrating, invisible friction is the exact problem that Interaction to Next Paint (INP) solves. As a core ranking signal in Google’s page experience ecosystem, INP marks a monumental shift in how we audit web performance: it stops looking at how fast a site loads and starts looking at how well a site behaves when a flesh-and-blood human tries to use it.
The Secret Anatomy of an Interaction
To fix a slow site, you first have to understand what happens under the hood when a user interacts with a page. Old performance metrics like First Input Delay (FID) were highly deceptive. FID only measured the initial lag of the very first click on a page, and it stopped recording the moment the browser started processing that click. It completely ignored what happened during the actual execution of your code and missed the massive delay before the browser could visually update the screen.
INP tracks every single click, tap, and keyboard entry throughout the entire lifetime of a user’s session. It then reports the worst delay on the page—specifically targeting the 98th percentile of your traffic to throw out random device anomalies. Every single interaction is a multi-step relay race split into three distinct, measurable phases:
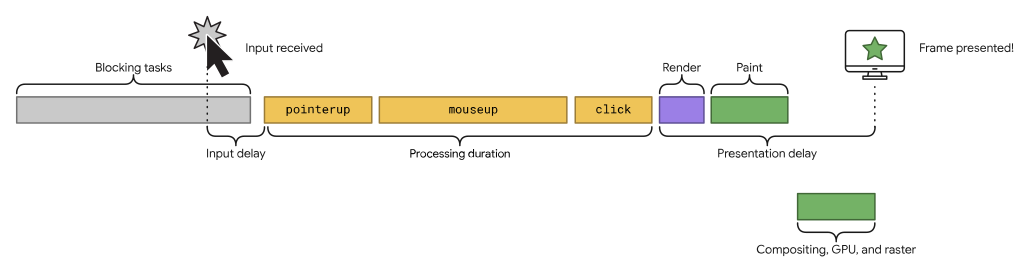
- Input Delay: This is the waiting period between the exact millisecond the user touches the screen and the moment the browser's main thread is free enough to actually trigger your JavaScript event listener. If a heavy background script is hogging the thread, the user sits helplessly in a queue.
- Processing Duration: This is the amount of time it takes for your JavaScript event callbacks (like
pointerup,mouseup, orclick) to fully execute their internal logic. If your code is running heavy loops or parsing massive JSON payloads synchronously, this block expands drastically. - Presentation Delay: Once your JavaScript finishes running, the browser still has to calculate the new CSS styles, recalculate the page layout, and physically repaint the pixels on the screen.
Your overall INP score is the total sum of these three phases combined. To pass Google’s Core Web Vitals assessment, that entire lifecycle must wrap up in 200 milliseconds or less. If it climbs between 200 and 500 milliseconds, Google marks your site as "Needs Improvement." Anything past 500 milliseconds feels broken to the user and actively damages your mobile search visibility.
How INP Differs from Legacy Metrics
To understand why optimization strategies have shifted, it helps to look at exactly how Google evolved its evaluation parameters from the old framework to modern standard processing rules:
| Metric Attribute | First Input Delay (FID) | Interaction to Next Paint (INP) |
|---|---|---|
| Session Lifecycle Scope | Only records the very first user interaction. | Monitors all interactions throughout the full visit. |
| Measurement End Point | Stops the clock the millisecond code processing begins. | Stops only when pixels physically change on the screen. |
| Target Vulnerability | Only catches early background thread blocking issues. | Catches slow code, heavy loops, and layout problems. |
Why Traditional JavaScript Code Blocks the Main Thread
The primary villain behind a high INP score is almost always long-running JavaScript tasks. The browser's main thread is a single-lane highway. It can only do one job at a time. It handles parsing HTML, running JavaScript scripts, calculating layouts, and painting styles sequentially.
When an event handler triggers a task that locks up the main thread for longer than 50 milliseconds, it becomes a "Long Task." If a user clicks a button while a long task is executing, the browser cannot pause mid-task to handle the input. It forces the click event to sit and wait in the queue, creating a massive spike in Input Delay.
Consider a standard filter feature on an SEO audit platform. When a user clicks a checkbox to filter technical audit issues, a developer might write a synchronous function that sorts a large array of URLs, updates multiple DOM elements, and modifies layout views all in one single run. To a desktop user on a high-end development machine, it might feel fast. But when a mobile user on a budget phone hits that same button, their slower mobile CPU causes that single JavaScript task to swell into a 400-millisecond blocking block.
Implementing the Modern Yielding Pattern
The most effective way to optimize your processing duration and clear out input delays is a concept called yielding to the main thread. Instead of forcing the browser to complete a massive monolithic block of code all at once, you should break the work apart into micro-chunks. This gives the browser small breathing windows to pause, check if the user clicked anything else, update the visual interface, and then return to finish the background calculations.
The Problem: Synchronous Blocking Code
// This function blocks the main thread completely until the entire loop finishes
function unoptimizedAuditData(items) {
  items.forEach(item => {
    // An intensive audit layout computation step per item
    performHeavyCalculation(item);
    renderItemToDOM(item);
  });

  // The UI doesn't update visually until this entire loop finishes running
  showSuccessStatusUI();
}
If the code snippet above processes 1,000 site URLs, the browser's main thread is completely hijacked. The page freezes completely, and any clicks that occur during this time will fail the INP threshold. Here is how we rewrite this into a fully humanized, yield-capable framework using an asynchronous worker loop that leverages built-in timing APIs:
The Solution: Non-Blocking Asynchronous Code
// A helper that tells the browser: "Take a quick breath, paint the screen, then come back to me."
function yieldToMainThread() {
  if (typeof scheduler !== 'undefined' && scheduler.yield) {
    return scheduler.yield();
  }
  return new Promise(resolve => setTimeout(resolve, 0));
}

// Optimized, non-blocking asynchronous loop
async function optimizedAuditData(items) {
  let lastYieldTime = performance.now();

  for (let i = 0; i < items.length; i++) {
    performHeavyCalculation(items[i]);
    renderItemToDOM(items[i]);

    // Check if we have been running code continuously for over 16 milliseconds (one frame length)
    if (performance.now() - lastYieldTime > 16) {
      // Pause execution, allow the browser to paint any clicks or UI changes, then resume right here
      await yieldToMainThread();
      lastYieldTime = performance.now();
    }
  }

  // Crucial: Update the user interface status immediately so the user sees instant feedback
  showSuccessStatusUI();
}
By wrapping the data iteration loop inside an asynchronous container and checking the frame execution budget via performance.now(), the browser never locks up for more than 16 milliseconds at a time. If a user clicks an element while this processing is happening, the browser catches the input during the next immediate yield phase, keeping the interaction quick and responsive.
The Hidden Culprit: Rendering and Layout Thrashing
Even if your JavaScript execution is incredibly fast, your site can still suffer from poor INP scores during the final stage: Presentation Delay. This occurs when your code changes styles or elements in a way that forces the browser to do an excessive amount of layout calculations.
A classic mistake that completely tanks presentation metrics is Layout Thrashing. This happens when your JavaScript code mixes layout reads (asking the browser for an element's width or height) and layout writes (changing an element's style or margin) inside a rapid sequence or a tight loop.
// Layout Thrashing Example: Causes terrible presentation delay
function badResizeLayout(elements) {
  elements.forEach(el => {
    // Read the current layout property (Forces a synchronous style recalculation)
    const currentHeight = el.offsetHeight;

    // Write a new style property (Invalidates the layout immediately)
    el.style.height = (currentHeight + 10) + 'px';
  });
}
Every time the loop above hits a read step after a write step, it forces the browser to immediately halt everything and recalculate the entire page layout on the spot just to give you an accurate width or height number. To optimize presentation speeds, you must separate your operations clearly: perform all your DOM data reads first, cache those numbers inside local variables, and then batch all your style changes into a single final write sequence.
Monitoring Real-World User Field Data
You can check your site’s code in a local laboratory using Chrome DevTools with a simulated CPU slowdown, but lab environments cannot accurately recreate the chaotic realities of real-world mobile interactions. To truly know if your optimizations are working, you must monitor live user data.

As illustrated in the monitoring dashboard above, an app might have a perfectly healthy, green Largest Contentful Paint score of 1.64 seconds, but still fail its absolute performance assessment due to an elevated, orange Interaction to Next Paint value sitting at 228 milliseconds. This type of real-world diagnostic field tracking is populated by the Chrome User Experience Report (CrUX). If real users consistently click buttons on your site and experience slow layout delays while commuting on mobile connections, your score will drift upward into the danger zone regardless of how pristine your desktop lighthouse reports look.
To protect your site from these sudden performance drops, integrate the open-source web-vitals library directly into your production application layer. By capturing performance data on live sessions, you can log real-world user metrics directly back to your reporting server, allowing you to catch specific unoptimized elements long before they trigger a penalty in Google's indexing systems.